Valuations, Velocity, and VIX Point To A Probabilistic Pullback In S&P 500 (SPY)
VIX hit a new yearly low. S&P 500 hit a new yearly high. Playing for a pullback by buying puts on SPY has never been cheaper over the past 12…
This story originally appeared on StockNews
VIX hit a new yearly low. S&P 500 hit a new yearly high. Playing for a pullback by buying puts on SPY has never been cheaper over the past 12 months.
We like to employ a multi-faceted approach to trade idea generation at POWR Options. Combining fundamental, technical, and implied volatility (IV) analysis to find an edge.
A quick walk through of the process is highlighted our most recent analysis of the S&P 500 below. We will use both SPX and SPY interchangeably in the discussion since many traders likely trade SPY versus SPX.
Valuations
Always prefer looking at Price/Sales versus the more widely followed Price/Earnings (P/E) ratio since earnings can be more easily gamed by stock buybacks and accounting tricks. Price/Sales is a cleaner number.
The recent run-up in the SPX wasn’t based on torrid earnings or revenue growth but was simply more of a multiple expansion.
In terms of revenues, analysts have decreased their estimates during the upcoming quarter. As of Friday, the S&P 500 is expected to report (year-over-year) revenue growth of 3.2%, compared to the expectations for revenue growth of 3.9% on September 30. So, slowing growth on the horizon.
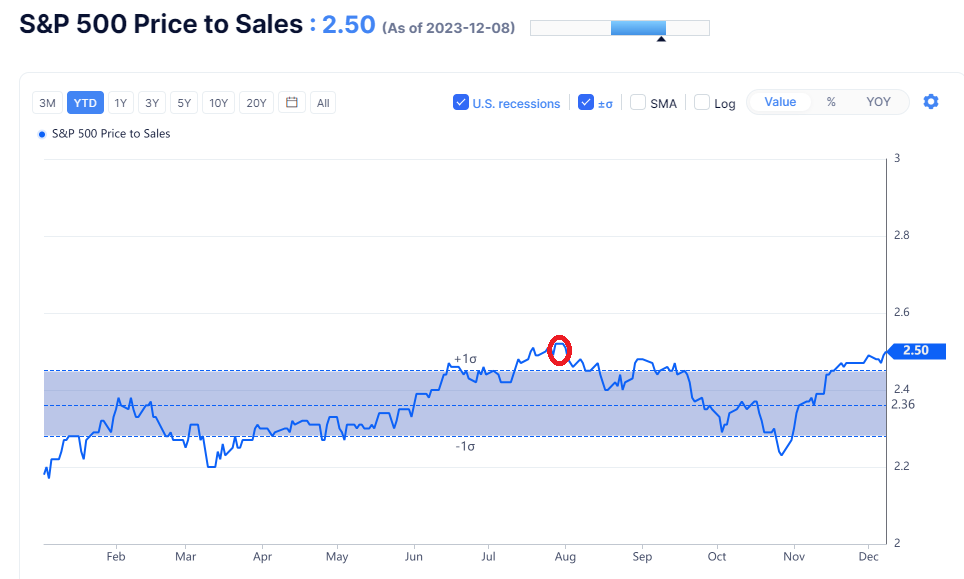
The current Price/Sales (P/S) ratio in the S&P 500 is now back at the 2.5x level and nearing the loftiest levels in the past year. It is also more than 1 standard deviation higher than the average over the prior 12 months as well.

Indeed, the last time the S&P 500 traded at such a lofty multiple was late July which marked a significant short-term top in the market as seen in the chart.
Velocity
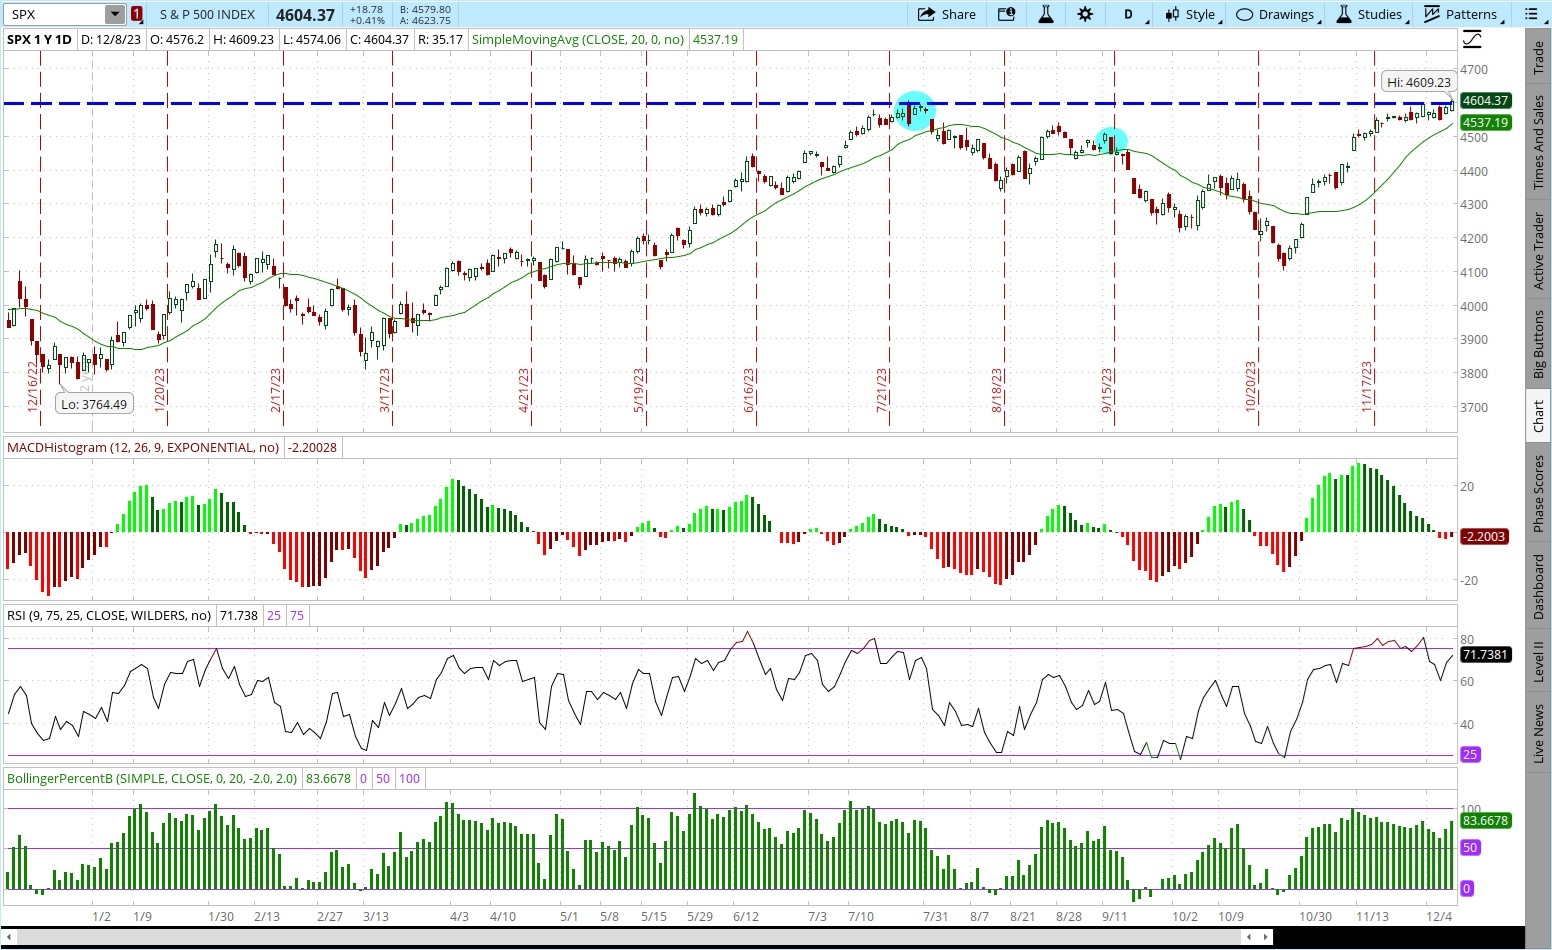
The SPY is starting to lose upside momentum as it stalls out at the $4600 resistance level. 9-day RSI got to overbought levels but has weakened. Bollinger Percent B approached 100 then softened. More importantly, MACD just generated a sell signal by turning negative even as the S&P 500 hit an annual high.

The previous two times this occurred coincided with a sharp pullback in the S&P 500 as highlighted in the chart above. See if the same happens once again.
VIX
The VIX made a new annual low on Friday, closing below the key 12.50 level after hugging that price level for two weeks.

The previous two times it got to such depressed readings after extended consolidation coincided precisely with tops in the SPX shown below.This may once again be an opportune time to take a short-term short position in the S&P 500.
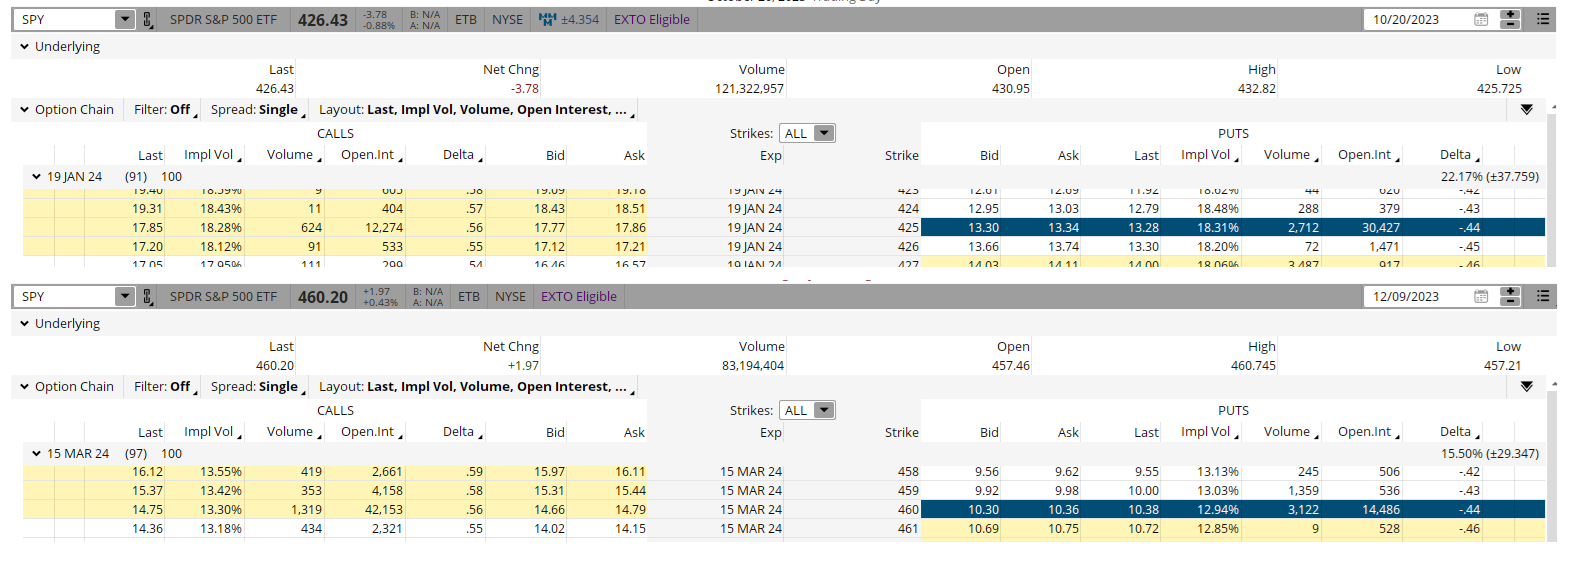
The new low levels of VIX also mean option prices are the cheapest they have been in a year. A comparison of put prices from October 20 (when S&P 500 was near the lows) versus Friday’s close with SPY at highs shows just how much cheaper.

On October 20, the SPY closed at $426.43. The slightly out-of-money $425 put ($1.43 out-of-the-money) was trading at $13.32 and had 91 days to expiration (DTE). Implied volatility (IV) was over 18.
Friday shows that the SPY closed at $460.20. The at-the-money put (only 20 cents out-of-the money) was trading at $10.33 and had 97 DTE. Implied volatility was just under 13.
So, the current at-the-money $460 put had more time to expiration (97 days versus 91 days) which should theoretically make it more expensive. It was also slightly less out-of-the money ($0.20 compared to $1.43) which should make it more expensive.Plus, the SPY was higher priced by nearly 34 points which should make the price of the comparative put higher priced as well.
But, IV has been hammered to the lowest levels of the year. In our example, the puts fell from over 18 to under 13 IV. This makes option prices much cheaper. To put it in percentage perspective, the cost of the puts fell from over 3%in October to just over 2% now.
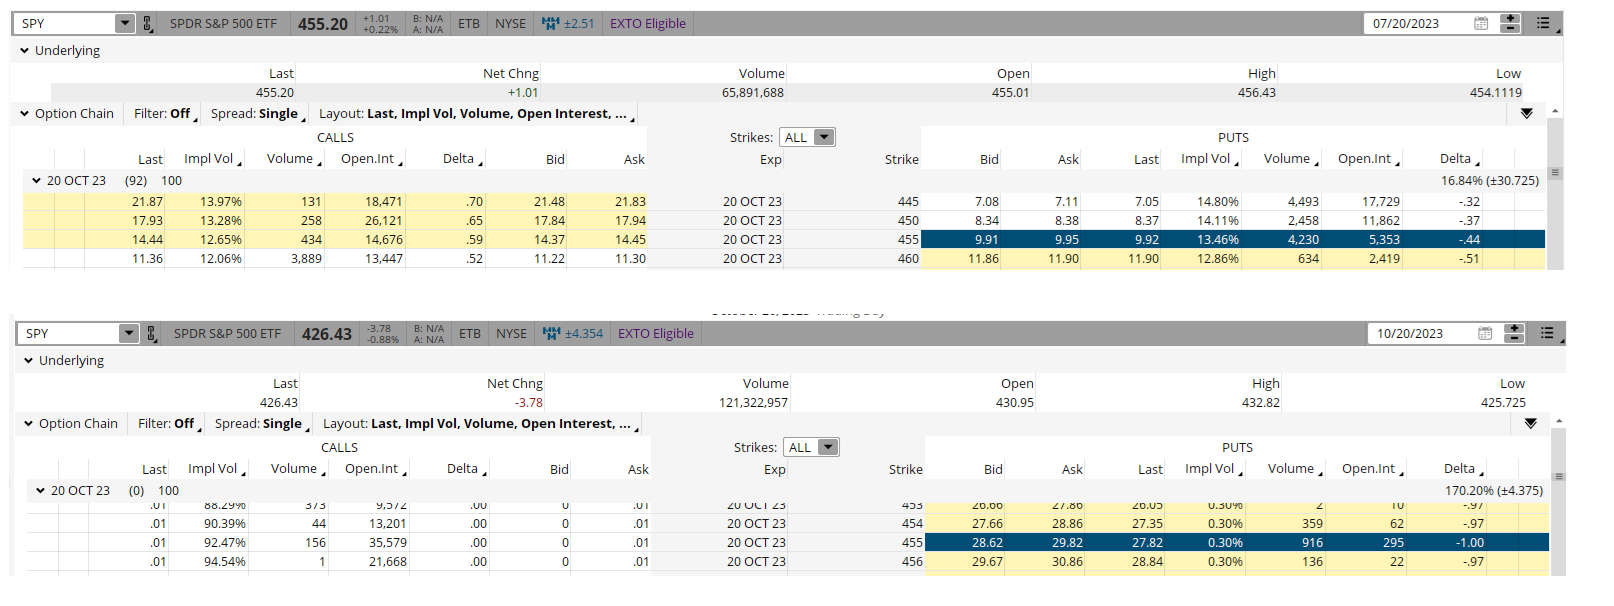
If you had bought the similar at-the-money puts last time SPY was this almost this high and VIX was almost this this low in late July, you would have been rewarded very nicely as shown in the option montages below.

The at-the-money October $455 puts with 92 DTE could have been bought for just under $10 on 7/20. These same puts closed on October expiration at just under $30. This equates to a 200% return in three months.
Certainly, not all trades will work out this well or even this profitably-if profitably at all. This is trading after all.
But using the POWR Options approach can put the odds in your favor. And at the end of the day, trading is all about probability, not certainty.
POWR Options
What To Do Next?
If you’re looking for the best options trades for today’s market, you should check out our latest presentation How to Trade Options with the POWR Ratings. Here we show you how to consistently find the top options trades, while minimizing risk.
If that appeals to you, and you want to learn more about this powerful new options strategy, then click below to get access to this timely investment presentation now:
How to Trade Options with the POWR Ratings
All the Best!
Tim Biggam
Editor, POWR Options Newsletter
SPY shares closed at $460.20 on Friday, up $1.97 (+0.43%). Year-to-date, SPY has gained 21.67%, versus a % rise in the benchmark S&P 500 index during the same period.
About the Author: Tim Biggam

Tim spent 13 years as Chief Options Strategist at Man Securities in Chicago, 4 years as Lead Options Strategist at ThinkorSwim and 3 years as a Market Maker for First Options in Chicago. He makes regular appearances on Bloomberg TV and is a weekly contributor to the TD Ameritrade Network “Morning Trade Live”. His overriding passion is to make the complex world of options more understandable and therefore more useful to the everyday trader. Tim is the editor of the POWR Options newsletter. Learn more about Tim’s background, along with links to his most recent articles.
The post Valuations, Velocity, and VIX Point To A Probabilistic Pullback In S&P 500 (SPY) appeared first on StockNews.com
VIX hit a new yearly low. S&P 500 hit a new yearly high. Playing for a pullback by buying puts on SPY has never been cheaper over the past 12 months.
We like to employ a multi-faceted approach to trade idea generation at POWR Options. Combining fundamental, technical, and implied volatility (IV) analysis to find an edge.
A quick walk through of the process is highlighted our most recent analysis of the S&P 500 below. We will use both SPX and SPY interchangeably in the discussion since many traders likely trade SPY versus SPX.


