2 Paths for Stocks from Here The recent rally for the S&P 500 (SPY) is nice to see. However, it is quite possible this is the end of the line for recent stock gains with more...
This story originally appeared on StockNews
The recent rally for the S&P 500 (SPY) is nice to see. However, it is quite possible this is the end of the line for recent stock gains with more downside ahead. To explain the 2 distinct possibilities for stocks at this time is 44 year investment veteran Steve Reitmeister who shares this updated marketing outlook with trading plan and top picks in the article below.
The movement of the stock market the last several months has been clearly tied to the story of high inflation and when the Fed looks ready to start lowering rates.
The dovish tilt from the Fed on November 1st sparked a 6 month rally to new heights.
Whereas stubbornly high inflation and Fed staying put with higher rates for longer is what put the April correction in motion.
Thus, on Tuesday, with the PPI report WAY ABOVE expectations, coupled with hawkish comments from Powell, then the continued rise in stocks back towards the previous highs is very much a head scratcher.
We will break this all down and a bit more in this week's Reitmeister Total Return commentary.
Market Commentary
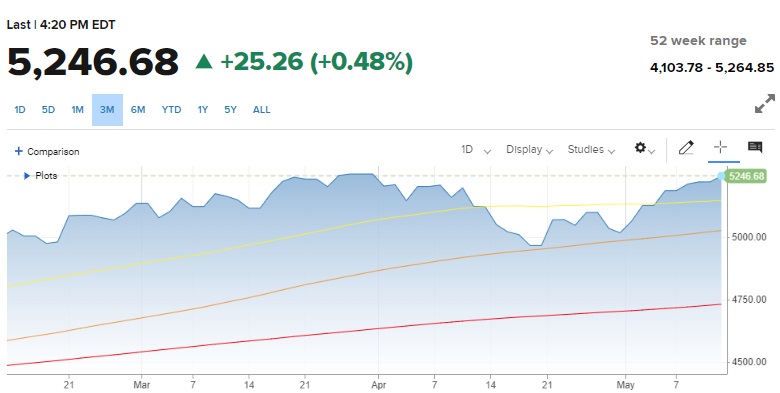
The S&P 500 (SPY) ended Tuesday's session just a few ticks under 5,247. That is well above the April lows and just a stone throws away from the all time highs of 5,265.
As shared in the intro, this continued enthusiasm for stocks seems a bit unfounded given the latest round of inflation news. I am referring to Tuesday's release of the Producer Price Index (PPI) which showed the 4th straight month of higher results.
This time around the yearly pace increased from 1.8% to 2.2% on the back of well above expectations 0.5% month over month increase. For those doing math in your head...that monthly pace is closer to 6% annually when the Fed wants things cooling down to 2%.
Typically, this kind of news leads to bond rates on the rise and stock prices heading lower. Yet the opposite happened. In fact, the probability of Fed rate cuts at their July 31st and September 18th meetings was increased.
This does not jive well with Tuesday's comments from Chairman Powell where he was quoted as saying they are not particularly pleased with recent inflation data and will have to stay with higher rates for longer.
There are only 2 possible ways to explain this.
First, is that we are simply playing in a trading range between 5,000 and the previous highs of 5,265. Traditionally, all moves inside a trading range are just noise with no real connection with fundamental facts. Just the mindless jitterbugging of prices.

Moving Averages: 50 Day (yellow) @ 5,143 > 100 Day (orange) @ 5,015 > 200 Day (red) @ 4,723
If this case holds true, then we are near the top of the trading range and will soon be heading lower.
The second possibility is that investors are looking beyond the current inflation data with signs that the economy is weakening. The chain reaction that flows from that is lower demand which begets a softening of price inflation.
If this is true, then stocks might be ready to break higher.
Right now, I put pretty low odds on this second scenario. Just don't see the proper fuel in place to have prices moving markedly higher in the near term.
Most of that is the lack of improvement...or even worsening of the inflation picture. On top of that is the traditional soft summer months for market. And the cherry on top is the weakness that usual flows for stocks in the months preceding a Presidential election.
So, my money rides on stocks floating lower in the trading range in the weeks ahead. With that I would lean into a more conservative mix of stocks; Larger cap...lower beta...conservative industries.
Then as you move lower in the range, back towards 5,000, it is wise to pick up more shares of your favorite growth stocks as discounted prices. This mix of conservative elements and targeted scalping of the stocks with the most upside potential should help you carve out some nice profits even as the market mostly churns sideways.
What To Do Next?
Discover my current portfolio of 12 stocks packed to the brim with the outperforming benefits found in our exclusive POWR Ratings model. (Nearly 4X better than the S&P 500 going back to 1999)
This includes 5 under the radar small caps with tremendous upside potential.
Plus I have 1 special ETF that is incredibly well positioned to outpace the market in the weeks and months ahead.
This is all based on my 44 years of investing experience seeing bull markets...bear markets...and everything between.
If you are curious to learn more, and want to see these lucky 13 hand selected trades, then please click the link below to get started now.
Steve Reitmeister's Trading Plan & Top Picks >
Wishing you a world of investment success!

Steve Reitmeister…but everyone calls me Reity (pronounced "Righty")
CEO, StockNews.com and Editor, Reitmeister Total Return
SPY shares were trading at $523.30 per share on Tuesday afternoon, up $2.39 (+0.46%). Year-to-date, SPY has gained 10.44%, versus a % rise in the benchmark S&P 500 index during the same period.
About the Author: Steve Reitmeister

Steve is better known to the StockNews audience as "Reity". Not only is he the CEO of the firm, but he also shares his 40 years of investment experience in the Reitmeister Total Return portfolio. Learn more about Reity's background, along with links to his most recent articles and stock picks.
The post 2 Paths for Stocks from Here appeared first on StockNews.com


